
There may be a Moral, though some say not;
I think there’s a moral, though I don’t know what.
But if one gets better, as the other gets wuss,
These Two Little Bears are just like Us.
~ from Twice Times, by A.A. Milne
Now that it’s all over perhaps we should look back at the 2019 season, and the 2019 Thorns both as a team and as individual players.
As a team, obviously, we and they were disappointed by the third-place finish and the early exit.
But as individuals certain players can stand out – both for their skills and for pure desire and hard work – even in disappointment, and in the Thorns tradition I’m here to hand out the roses as Riveters do, even in defeat.

Though every rose has its thorn, and final grades for the season might not be all flowers and happy sunshine.
So.
The 2019 season continued the slide the team has been on since the second Championship season of 2017. Despite each being a “success” in absolute terms – making the Final again in 2018 and the playoffs in 2019 – each of the last two seasons has been less successful than the one before it.
In 2017 the Thorns went 14-5-5 (winning percentage, 58%), finishing second. Goals for, 37, goals against, 20, a goal differential (GD) of +17.
By 2018 the Thorns’ record had dropped to 12-6-6 (50%) but the team again finished second; GF 40, GA 28, +12GD.
In 2019 the Thorns went 11-6-7 (46%) and finished third; GF 40, GA 31, +9GD.
I hope you’ll notice something that bodes poorly for the subjects of our study; despite producing offensively (tied for third in goals scored in 2019, second in the league in both previous seasons) the Thorns’ concession rate has been getting steadily worse since they posted the best goals-against record in the NWSL in 2017.
After finishing second in 2018 our 28 concessions put the Thorns defense in 4th or 5th; behind the Damned Courage (17GA), Seattle (19GA), and Utah (23GA), and tied with fourth place finisher Chicago.
This past season the Thorns’ 31 goals conceded dropped them into the dregs of the league, 6th, behind second-place Chicago’s 28 and only leading Sky Blue’s 34 and Houston’s 36 by a handful. Orlando? Fifty-three conceded, and we shall not speak ill of the dead. But 6th in a 9-team league?
That’s…sub-optimal.
While we discussed the scoring issues that killed the team in Black Autumn in our last post, the Thorns defensive woes clearly played a role in the descent from Champions to runners-up and then to semifinal-second-best.
The big question is; why? What’s happened, or is happening, to the Thorns backline and keepers that have made life more difficult at the Red end of the pitch.
Defending is a team effort, and to discover what contributed to the team’s troubles we have to pick the team apart. Was it lapses in the backline? Was it goalkeeping? Was it failure to hold possession in midfield? Was it some combination of the above?
Today we’re going to start by looking at the ultimate defenders; the keepers
A.D. Franch and Britt Eckerstrom
For the purposes of this study we can disregard Bella Geist; the third keeper didn’t play a second in 2019.
Unlike 2017, however, when A.D. Franch played every single minute of the season, for the second year in a row Franch and backup Britt Eckerstrom split the 24 regular season matches.
In 2018 that was because Franch got hurt. In 2019 the “problem” was glory, and Franch spent the ten matches she missed earning her backup-keeper’s mite of the gold coin that is the World Cup.
Eckerstrom stepped in and started the nine matches A.D. missed while in France, and then added a tenth when Franch was called back for the Tomato Can Tour game that conflicted with Sky Blue here on Matchday 15.
In 2018 Eck went 3-4-3 with two clean sheets but a with a horrific four-goal defeat to The Damned on Matchday 11 and another three-goal loss to Seattle on Matchday 6, while Franch put up a 9-2-3, including three clean sheets, and without conceding more than two goals in any of her starts.
In 2018 Franch was clearly the better technical and tactical goalkeeper of the two.
This season Eckerstrom posted a 6-2-2 record; three clean sheets, but also two three-concession games, including the wild 4-3 home win over Orlando on Matchday 12 that still counts as one of her wins.
Franch put up a 5-4-5 with five clean sheets (although the last regular season match against Washington barely counts, given how little the Spirit put into that game). But she also gave up large-multiple goals twice; the 4-goal draw in Chicago on Matchday 2 and the horrific six-goal Destruction of Army Group Damned in September.
Here’s their PMRs over the past two seasons (and 2017, for Franch, by way of comparison)
(In case you don’t recall – What the heck is a PMR? Player ratings explained)
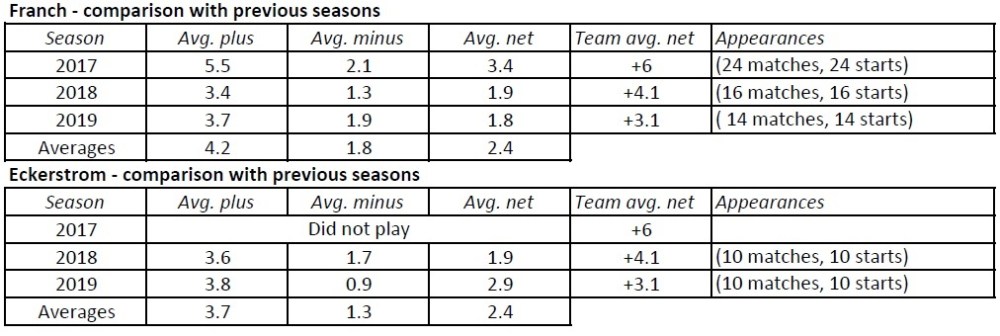
Here’s their 2019 net PMRs in graphic form, with the team’s average net to compare against.

The thing is, as I’ve explained here before, that the biggest flaw of the PMR system is the way it consistently under-rates keepers. A lot of what a good keeper does is pro-active; she controls her penalty area like a goldfish patrolling her tank. She organizes her backline to snuff out danger and anticipate attacks. She is always positioned well, so that her opponents have little opportunity for a quality shot.
Unfortunately, that’s not an “action” the way a great pass or a missed tackle is, so the PMR setup doesn’t record it well.
(For what it’s worth, in my opinion the InStat Index system grossly over-rates keepers, giving far too much credit to keepers who are forced to make a lot of saves because their backline is crap, and who keep clean sheets whether they face 20 SOG or two…)
Their seasonal PMRs do suggest that, after playing about the same level of quality in 2018, Eckerstrom took a small step up in 2019, largely by reducing her errors. Franch, meanwhile, seems to have lost a step or two on making the big plays; her “pluses” are down sharply since her genuine Goalkeeper of the Year season in 2017.

Another measure of quality is to compare a keeper’s goals conceded against the opponent’s chances as expressed as “expected goals”, xG.
An outstanding keeper should concede fewer goals than her opponent’s xG would suggest, giving her a “differential” that is expressed as a negative number. The bigger the negative, the fewer actual goals compared to expected goals, and hence the better the keeper.
An average keeper should be a net zero, letting in about as many as you’d think from her opponents’ chances – meaning a differential of near zero – while a poor keeper would goof and let in more than she should and end up with a positive value for her concessions-to-xG differential
Fortunately Chris Henderson kept track of all these numbers last season so I didn’t have to, and here’s his goalkeeper matrix for the last season (including playoffs):

One thing to recall about numbers in statistical analyses is that you need to be careful about weighting “outliers” – that is, a small population that contains values at the far ends of the dataset – too much
So, for example, if you just look at the raw numbers on the table you’re horrified by Lainey Burdett’s work for Orlando, or Lydia Williams’ horrible showing in Tacoma and thrilled by Sam Leshnak’s or Shea Yanez’ good numbers that boost them up there with the Naehers and Barnharts.
But all four are just the extreme effects of very small numbers of trials or data sets, what in statistics are referred to as “N” numbers.
Burdett and Williams got shelled, Lashnak and Yanez cruised, but all four have tiny “N” values and are, as such, just freakish statistical outliers.
If you take, instead, the “Average Differential” values for the keepers who played enough to establish their genuine quality – let’s say players that played 10 or more games in goal – you get a slightly different table with the following statistical metrics for “Average Differential per Game”:
Median: -0.24 (that is, the absolute middle number of the set – half above, half below)
Mean: -0.23 (the average value)
Mode: -0.25 (the most common value)
Standard Deviation: 0.32 (the term that expresses the range of values, or “scatter”)
If we use that dataset, it suggests that Franch’s -0.25 goals-to-xG ratio is almost perfectly average for a starting-quality 2019 NWSL goalkeeper, which seems about right based on the “visual test”; Franch had a roughly middle-of-the-road NWSL-goalkeeper sort of 2019 season.
Eckerstrom’s 0.08 is on the low end, but still well within the “normal distribution” range for a professional starting keeper in this league. Which, too, seems to fit; a backup, but a good backup that had a decent season.
Here’s an interesting statistic, and I’m not quite sure what to make of it.
One metric of the defense’s ability to prevent opponents from getting good looks at goal is to measure expected goals against total shots. A defense that keeps their opponent at bay and that forces poor-quality shots should have a relatively low xG-to-shot ratio.
A weaker defense – or a better opponent – will produce more xG per shot.
Here’s the xG-to-shot ratio for our keepers:

I’m not sure what to make of that. Franch’s defense gave up 50% more dangerous shots on goal than Eckerstrom’s. You’d think it would be the other way around; A.D. is their starting keeper, their familiar body between the sticks.
WTF?
(While we’re on the subject of xG ratio…look who’s at the top of the table:

That is fucking nuts.
Sheridan had an absolutely monster season behind the worst backline in the league. Casey Murphy, Aubrey Bledsoe, and Alyssa Naeher did fine; the three were head-and-shoulders above the other keepers in the league, including both of ours…
...but Sheridan? She was a utter beast, and deserved to be Goalkeeper of the Year. She was absolutely, positively robbed, and would be fully justified if she got to smack every GKotY award voter upside the head with one of her sweaty Fingersave gloves…)
Sorry. Right. Focus. Gotcha.
Anyway, below are some more metrics I think are worth considering, as well.
It’s a breakdown of both our keepers’ work this past several seasons broken down into:
– matches played,
– minutes played,
– shots faced,
– shots on goal,
– minutes-played per shot-on-goal; the first three metrics are a rough measure of how sturdy the defense in front of the keeper was playing,
– concessions,
– minutes-played per concession,
– ratio of concessions to shots-on-goal, and,
– goals-against-average, GAA, the standard measure of keeping expressed as the mean number of goals conceded per game.
First, here’s Franch:

There’s some things worth noting here.
- Franch had a beast of a season behind a monster of a backline in 2017; we knew that, and she was well-rewarded with title and the Keeper of the Year crown for it.
- The next two seasons Franch played behind a defense that posted roughly the same metrics as 2017; allowing roughly a shot on goal every 20 minutes and roughly one of every three shots was a shot on goal. In other words; over the past three seasons the defense in front of Franch didn’t change much
- But Franch’s concession rate slipped fairly sharply over that time; from a goal every 108 minutes to a goal abut every hour, from a goal for every five shots on goal to almost one in every three, and from less than a goal per game to almost a goal-and-a-half.
Now here’s Eckerstrom;

Eck’s numbers tell a little different story.
- Having let her face a shockingly large number of shots on goal – 43% of the shots at Eck were shots on goal, roughly 10% more than the defense allowed against Franch – in 2018, Eck’s defenders ground their issues down to the team mean in 2019; the SOG/shot ratio was indistinguishable from Franch’s this season.
- But Eckerstrom’s concessions-per-minute-played and her goals-against average jumped way up this season. Her concession rate per SOG went up a bit, but not shockingly so. Eck did noticeably better in 2019.
- For 2019 as a whole, here’s the two side by side:

I’m not saying that I’m ready to have Franch and Eck swap places. For one thing, it’s worth recalling that Franch’s stats are grossly impacted by the 6-goal loss to The Damned Courage. If PTFC loses 0-1 instead of 0-6, here’s how the two keepers match up:

But the point is that Franch DID concede six goals in that game. Even with the counterfactual nil-one loss it’s hard not to argue that Eckerstrom had a hell of a season, and Franch – by the standards of her best work – did not.
So. After all this, can we say something definitive about our goalkeeping in 2019?
Yes. One of the problems this past season was that while our backup keeper got better our starting goalkeeper…well, let’s not say she “got wuss”…but she had a significantly off year and has been heading there for the past two years.
Grades:
Franch: For the second year in a row A.D. Franch looked less sturdy than the year before. Her won-loss record and her statistical metrics were both down from 2018, and both seasons are well off the pace of her 2017 peak.
However, she posted a solid goals-to-xG ratio, and should probably get some credit for struggling through the World Cup period, where she missed any real match play for over a month.
In the final analysis it can’t be denied that she had a rough year for her club. That she has been better suggests that she could – and probably should – have been better.

Grade: C-
Franch needs to find a way to recover her form next season at the same time that she may possibly have another long absence with the USWNT for the Olympics. That’s going to be difficult given her current trajectory, but not impossible. Franch and her coaches need to recognize her issues, however, and commit to putting in the work to reverse her slide.
Eckerstrom: At the beginning of the season I questioned whether Eck was ready for prime time. I think the past season makes it clear that she is. She still has some way to grow, but she is still growing – she’s only 26 – and should have not just a long career in front of her but 2019 suggests that career will be one of significant quality.
Grade: B+
Eckerstrom has been on a rising path over the past two seasons. She has steadied the defense in front of her, and now looks to be not just a quality backup but at or close to starting quality herself.
She needs to continue to grow and learn from Coach Angerer and her teammates. The question now is not whether, but when, she is ready to put on the gloves of the regular starter.
My question now is; is that staring position here, or elsewhere..?

Next week: The Defenders get their report cards…
- Thorns FC: Kiss - June 3, 2026
- Thorns FC: Rough Road - May 29, 2026
- Thorns FC: Double Down - May 26, 2026